


In essence, we are people who love to travel and discuss science and innovation with the many amazing people we meet.
Below you will find some information on a few of the places we've visited and a short description of the academic research we do.
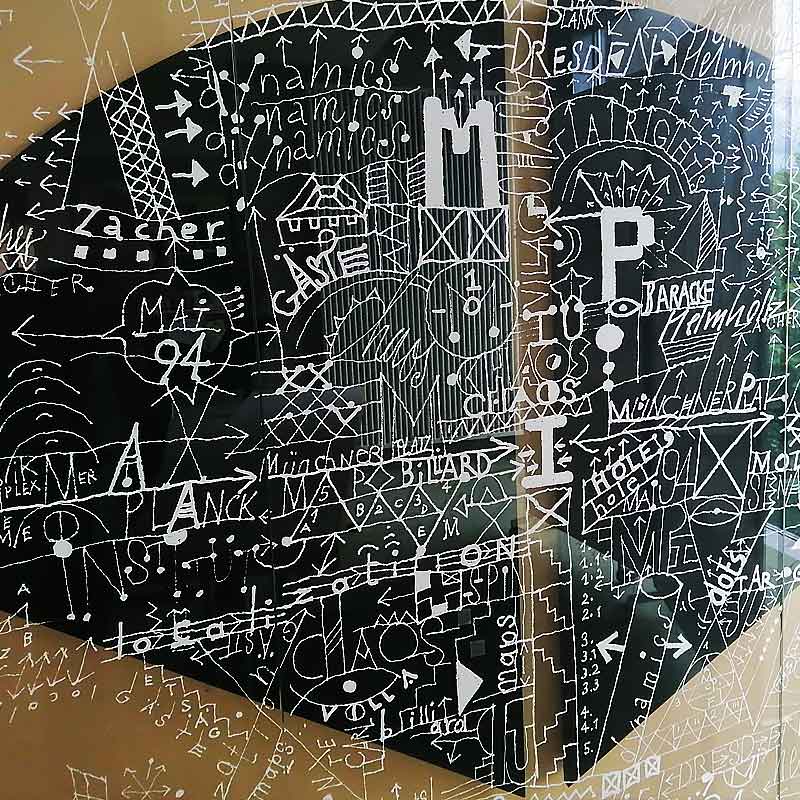
Max Planck Institute for the Physics of Complex Systems

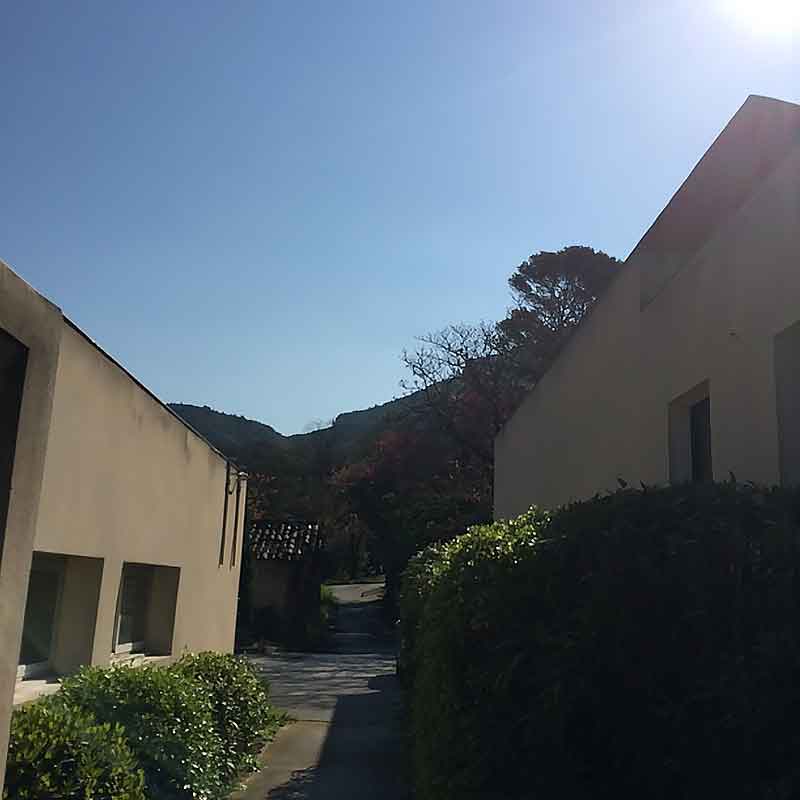
Centre International de Recontres Mathématiques


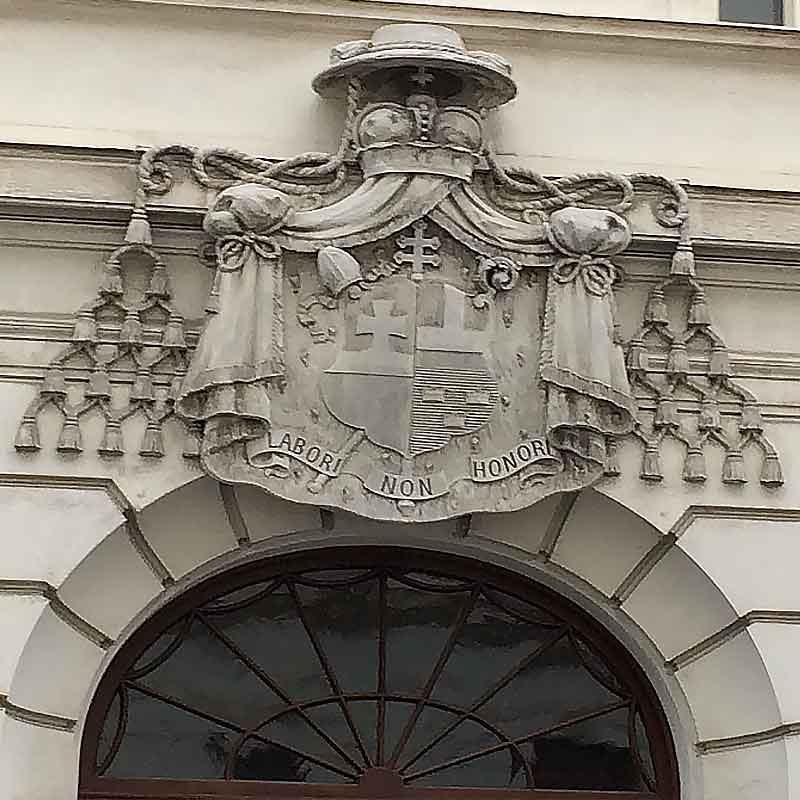
Erwin Schrödinger International Institute for Mathematical Physics

Probability & Statistics in Chaotic Systems: Using and creating cutting-edge statistical tools to predict the returns of rare events in systems that have randomness.
In a deterministic system, you know where you will be in the next time provided you know where you are right now. As an example, consider a pendulum swinging. You are certain where the pendulum will be in the future when you observe it in the present.
On the other hand, one strict property of a chaotic system is that two things may start very close together and end up far apart in the future. In these systems, we are not able to precisely predict where something will be next. Instead, we can use probability to determine the chance something will end up in a specified location. Adding a second pendulum to our first creates a chaotic motion for the bottom pendulum. See the video below for a demonstration of our homemade double-pendulum!
Chaotic systems exist everywhere in nature: weather, the stock market, genetics, pandemic dynamics … just to name a few!
When we look at chaotic systems and probabilities of events occurring inside these systems, it is of particular importance to investigate the systems’ extremes. Extremes are often observed as rare events so their probability of occurrence is very low; however, they often have very large socio and economic impacts. For example, hurricanes, droughts, and wildfires are all extreme events inside a weather system. An understanding of when these events will occur and how large they will be can allow us to create better preventive measures and evacuation procedures. This is particularly important in the midst of climate variability where the probability of these extreme weather events may be changing.
As part of a 2021 research collaboration, we have recently created an updated hurricane simulation model in MATLAB. The open source package can be downloaded here.
For quite a while, research and industry have been dominated by supervised learning algorithms or algorithms that take some input variables and provide an output. A simple example of this is linear regression modeling. In regression modeling you are given data and you want to predict something. For example, you may be given the price of an item and you may want to use this inside regression modeling to predict the number of sales of that item.

Here, we call the price of the item a “predictor variable” of the sales of that item.
Clustering algorithms are becoming more popular in academics and industry because they provide information on the structure of a system without the need for outside data (or predictor variables). Algorithms with this property are called unsupervised learning algorithms. When looking to apply clustering to a system, we often rewrite the system into a network of nodes and edges like the one below.

Here, an edge represents some positive similarity between two nodes. Clustering algorithms, like K-Means, look for mathematically defined "proper" separations in the network to group nodes that are "most similar" together.
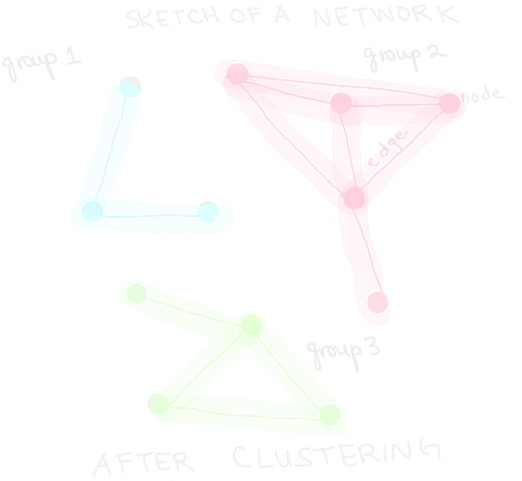
As a hard example, you can imagine that each node in the network is a station of weather data. Then, the grouping of certain nodes together tells us the regions on a map that have similar weather patterns. But these algorithms don’t just tell us about grouping information. They also tell us about movement through the network. For example, we can consider that each node is a person and their interaction time with another person gives some edge in the network. Then, we can ask questions about the most likely transmission path of a virus or which subgroup of people in the network is most likely to be infected by a single person. [Spoiler: this is one reason why social distancing works so well in practice!]
The above are just a few of the many applications of unsupervised learning. In fact, these algorithms can be applied to information, financial, agricultural, energy, and many other industry sectors (with proper adaptations, of course)!